

When it comes to professional data visualization, there are two key factors:
In order to meet these requirements in a climate of limited IT resources, departments are increasingly asked to analyze and format data themselves. Professional self-service software allow these departments to independently visualize data, reduce the time required to create reports and improve their quality.
Our consulting services
At SIEGER, we can provide you with full service support in the area of data visualization: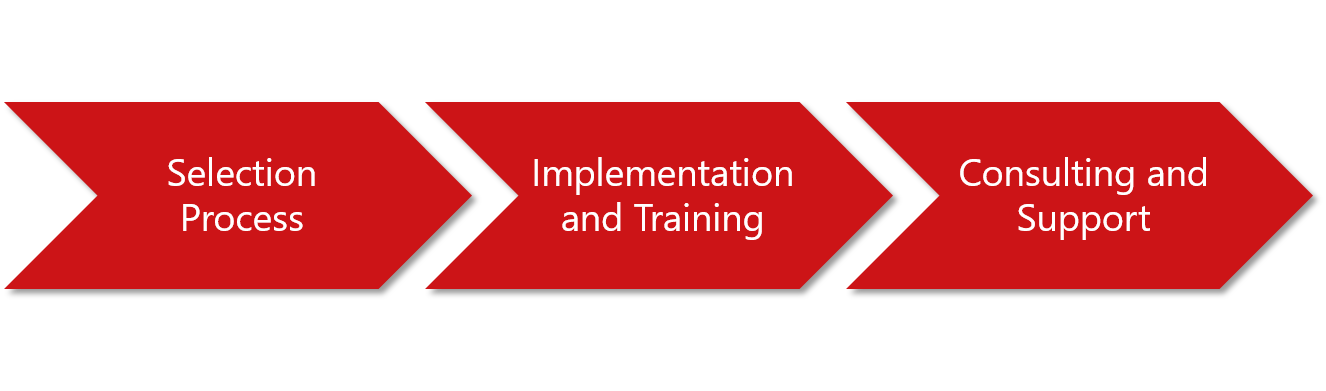
Given the broad range of tools available, it is important to select those which will provide the greatest benefit to your company when choosing your visualization software.
Our best practice approach at the outset of your project will train your key users quickly and efficiently. Meanwhile, our visualization manual makes sure to counter uncontrolled over-use of these tools.
Your requirements and wishes may evolve over time, so we are always happy to assist you with our range of specialized consulting services.

Herr Çetin
Senior BI Consultant &
Business Development Analytics
service@sgc.de